The “cost” of student loans
My book The Great University Gamble is now 3 years old. It was originally drafted in anticipation of the 2012 HE Bill that never arrived. It will regain some relevance in May as the government publishes a new HE White Paper and announces plans to legislate for HE in England on Wed 18 May (the Queen’s Speech).
The publisher, Pluto Press, is currently offering a 50 per cent discount on all their books, which you can access here. That brings the price of GUG down to £8.50.
Lately, I have been thinking about this diagram from the book.
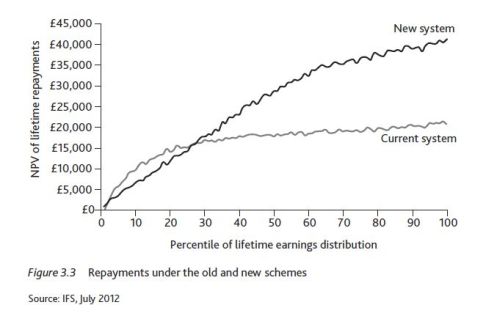
This graph produced by the IFS shows the “New” system, introduced for those starting undergraduate study in September 2012 (where tuition fees of up to £9000pa replaced teaching grants to institutions), with the “Current” system (for those who started “pre-2012”).
Things are not quite like this now but the chart illustrates four key aspects of the English fee-loan regime which seem to be always missed by journalists, think tanks and academics (most recently, the Sutton Trust).
- The ‘cost’ of undergraduate study from the vantage point of student loans is determined by the value of repayments made, not the debt on graduation.
- The “post-2012” loan system was meant to be cheaper for lower earners – the black line for ‘New’ is below the gray line for ‘Old’ when we are looking at the first quartile of graduate earners.
The estimated future repayments were projected to be lower despite the larger graduating debt. This was entirely due to lifting the repayment threshold to £21 000 (and index-linking it to average earnings from 2017). - Middle to higher earners would pay more – the higher graduating debt and above inflation interest keeps them in repayment for longer.
- Only those graduates with the very highest incomes were ever expected to make repayments the value of which would match the original loan outlay (c. £40 000 in the above diagram).[1]
The case was then made that the new fee-loan regime was more progressive than what existed for those who started between 2006-2011. (This blog has outlined several critiques of this new regime – not least that a focus on student loans ignores the other borrowing that students enter into, such as overdrafts, credit card debt and commercial lending).
What this means is that the government has chosen to fund higher education by subsidising individual borrowers. This is why there has been so much debate in recent years on the ‘RAB charge’ or the estimated ‘loss’ on loans issued each year.
US student loans do not share these ‘distributional’ features of UK loans: it’s therefore not legitimate to compare average debt on graduation as a guide to cost.
This is fundamentally different from other countries, including Scotland, where the government chooses to fund HE by giving grants direct to institutions. That ‘cost’ is direct can be calculated upfront. Loan repayment subsidies are indirect and cannot be calculated without making projections a long way into the future.
Any comparison of ‘cost’ which doesn’t grasp the different funding principles (and principals) at work has misunderstood what’s going on. If you want to compare the cost to graduates – say, England and US – then you need to analyse what repayments are generated by the loans. US loans are in general much more onerous and have little subsidy: they are more costly.
Missing the centrality of repayments also leads to bad politics – graduates in the first two earnings quartiles will be far more affected by the decision to freeze the repayment threshold at £21000 for five years, than by graduating with additional debt.
[1] Discounted figures. For more on discounting see here (and why you need to discount student loans repayments by at least RPI, here).


Trackbacks & Pingbacks