I must apologise for the lack of posting on this blog over the last two months. I fell ill in mid-May and spent a month in hospital. I am still recovering so posts over the summer may be irregular.
I published two articles with wonkhe on the HE White Paper just before I fell ill.
Ten Things you might have missed about the White Paper
The challengers (and challenges) in higher education market reform
Update: unfortunately I am not well enough to attend the EAC today but you can watch the session here
This coming Tuesday (5th July) I am scheduled to appear before the House of Lords Economic Affairs Commmittee, which is holding an evidence session on student loans. Also appearing will be Nick Hillman (HEPI) and Steve Lamey, chief executive of SLC.
Venue: Room 1, Palace of Westminster
Time: 3.15pm start
The SLC have confirmed to me that they took down the loan repayments calculator ‘temporarily’ for ‘maintenance and enhancement’.
In a separate statement to Radio 4’s Moneybox (who will cover the story today at 12 noon) they confirmed that ‘The Repayment Calculator changes will provide a more general reflection of earnings, that will not be based on male only.’
As analysed on here previously, the SLC loan repayment calculator made two serious errors:
- it overestimated male graduate salary pathways leading to early annual salary increases of over 15 per cent each year;
- and assumed all applicants were male.
It also failed to update its information on average earnings, missing that the the figure had dropped from 4.4 per cent to 1.9 per cent recently and that OBR had revised down the long-range projection of that figure to 3.5 per cent. (The graduate salary increments are added on to that general figure). But this point is secondary since the graduate salary pathways were based on annual percentage increments applied on top of the annual increment due to rises in average earnings. For more detail see the original post were I outlined the problems.
The end result was that the SLC’s official calculator was overestimating likely loan repayments.
Why is a more significant problem?
Firstly, it leads to misunderstandings of the loan scheme. Secondly, by presenting SLC loans – which are subsidised by government – as more expensive than they are likely to be, the SLC may lead applicants to consider alternative means of financing study. Private loans, which are not subsidised and must make a return for their backers, can only present themselves as a cheaper alternative to SLC loans, if the SLC trades in overestimates.
The repayment threshold in SLC loans protects borrowers with lower earnings – this is why I have long argued that political efforts should centre on protecting such features more than arguments about the level of tuition fees. The recent decision to freeze the repayment threshold will have much more impact on the repayments of lower and middle earners than the decision to abolish maintenance grants. (NB: if you have never seen the figures supporting that case, you should follow the link).
It only remains to say one thing – an awful lot of academic and think tank work (as well as other calculators) has been based on the SLC calculator (which was also hosted on directgov). All these studies and analyses are flawed and didn’t ask basic questions about the likelihood of these very high cash totals that the calculator was generating.
For example, it is not uncommon to see claims that the average borrower will repay £100,000.
Here’s the kind of questions borrowers and analysts should ask when they see such figures. What must I have earned to repay such amounts? (A major flaw of the SLC presentation was it didn’t show applicants the earnings pathway underpinning the repayment estimates)
Roughly:
let’s say £100,000 is repaid over 30 years. That’s £3,333 of repayments per year. To repay £3,333 at present you’d have to be earning over £58,000 (3,333 / 0.09 + 21,000).
Now bear in mind that the £21,000 repayment threshold in these models is increasing by average earnings from 2020, so 4.4% every year for the disgraced SLC model! leading to a threshold over £60,000 itself at the end of the repayment period. To generate an average of £3,333 in repayments over 30 years takes some very big salaries. How likely is that for every borrower or even for the average borrower? (Only if inflation is such that our present reference points are largely meaningless.)
To repeat a basic point, income contingent repayment loans are unfamiliar loans. They do not behave like fixed period loans (or ‘mortgage-style’) loans.
Repayments are contingent on earnings, so you should always ask, ‘what earnings model underpins these figures?’ and ‘what percentage of income is repayable each period?’ – that is invariably more important that the starting debt or interest rate (two aspects of fixed period loans that do not have the same significance here).
My book The Great University Gamble is now 3 years old. It was originally drafted in anticipation of the 2012 HE Bill that never arrived. It will regain some relevance in May as the government publishes a new HE White Paper and announces plans to legislate for HE in England on Wed 18 May (the Queen’s Speech).
The publisher, Pluto Press, is currently offering a 50 per cent discount on all their books, which you can access here. That brings the price of GUG down to £8.50.
Lately, I have been thinking about this diagram from the book.
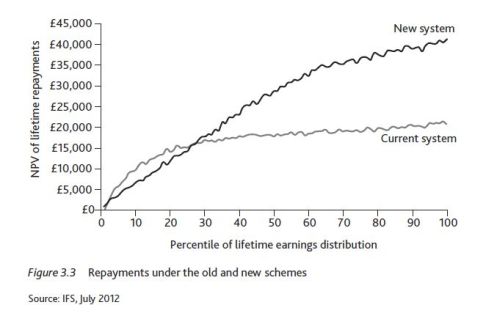
This graph produced by the IFS shows the “New” system, introduced for those starting undergraduate study in September 2012 (where tuition fees of up to £9000pa replaced teaching grants to institutions), with the “Current” system (for those who started “pre-2012”).
Things are not quite like this now but the chart illustrates four key aspects of the English fee-loan regime which seem to be always missed by journalists, think tanks and academics (most recently, the Sutton Trust).
- The ‘cost’ of undergraduate study from the vantage point of student loans is determined by the value of repayments made, not the debt on graduation.
- The “post-2012” loan system was meant to be cheaper for lower earners – the black line for ‘New’ is below the gray line for ‘Old’ when we are looking at the first quartile of graduate earners.
The estimated future repayments were projected to be lower despite the larger graduating debt. This was entirely due to lifting the repayment threshold to £21 000 (and index-linking it to average earnings from 2017). - Middle to higher earners would pay more – the higher graduating debt and above inflation interest keeps them in repayment for longer.
- Only those graduates with the very highest incomes were ever expected to make repayments the value of which would match the original loan outlay (c. £40 000 in the above diagram).[1]
The case was then made that the new fee-loan regime was more progressive than what existed for those who started between 2006-2011. (This blog has outlined several critiques of this new regime – not least that a focus on student loans ignores the other borrowing that students enter into, such as overdrafts, credit card debt and commercial lending).
What this means is that the government has chosen to fund higher education by subsidising individual borrowers. This is why there has been so much debate in recent years on the ‘RAB charge’ or the estimated ‘loss’ on loans issued each year.
US student loans do not share these ‘distributional’ features of UK loans: it’s therefore not legitimate to compare average debt on graduation as a guide to cost.
This is fundamentally different from other countries, including Scotland, where the government chooses to fund HE by giving grants direct to institutions. That ‘cost’ is direct can be calculated upfront. Loan repayment subsidies are indirect and cannot be calculated without making projections a long way into the future.
Any comparison of ‘cost’ which doesn’t grasp the different funding principles (and principals) at work has misunderstood what’s going on. If you want to compare the cost to graduates – say, England and US – then you need to analyse what repayments are generated by the loans. US loans are in general much more onerous and have little subsidy: they are more costly.
Missing the centrality of repayments also leads to bad politics – graduates in the first two earnings quartiles will be far more affected by the decision to freeze the repayment threshold at £21000 for five years, than by graduating with additional debt.
[1] Discounted figures. For more on discounting see here (and why you need to discount student loans repayments by at least RPI, here).
Earlier this month, I interviewed Jack Britton, Senior Research Economist at the IFS, regarding their recent report on graduate earnings: “How English domiciled graduate earnings vary with gender, institution attended, subject and socio-economic background”.
The interview was published on wonkhe and now includes some very useful comments from Mike Picken regarding the reliability of using JACS subject codes to identify different subjects.
I would also add a couple of caveats:
- the report is based on students who first took out loans in 1999 so it is likely that we are looking at the results of courses that were validated nearly 20 years ago.It is very difficult to see how such a ‘lag’ can make for an effective performance metric (in for example the TEF). It’s clear that any institution which aimed to influence this kind of data (through fair means) would be looking for impact decades away – this is only going to create perverse incentives. (Publishing this data is a different issue but similar caveats apply.)
- the IFS themselves have described their non-graduate data as ‘tentative’ [1], since their data is built on the records of ‘student borrowers’: 15 per cent of the student population in the late 90s did not take out maintenance loans and these are therefore mixed up in the non-graduate population. A reasonable assumption would be that those non-borrowers came from wealthier backgrounds: the main finding of the IFS report is that significant ‘wealth effects’ affect graduate earnings. This in part explains the use of ‘creative arts and design’ as the baseline in much of the analysis.
[1] “Our third data set … uses econometric methods to adjust for the fact that some of the individuals in the [sample] will be graduates. Specically we attempt to adjust for former English domiciled students who do not borrow and for former students who were domiciled in Wales, Scotland and Northern Ireland when they started in HE and thus who are not eligible to borrow from the English part of the SLC. This is our best, but tentative, estimate of the earnings of non-graduates in England. We compare our results for non-graduates with those obtained by using the Labour Force Survey.”
p. 5, IFS Working Paper W15/28
“Higher education loan fiasco sets $185bn time bomb”
That’s the headline at the Australian.
It continues to outline concerns that have lead to discussion about recovering debts from dead graduates and their families.
The nation faces a $185 billion funding time bomb from soaring student debts at universities and technical colleges, in a shock analysis that will force a new approach to education policy to avert an “unsustainable” blow to the federal budget.
The Turnbull government admitted the risk from “ballooning” costs in higher education as politicians blamed each other for policies that will deepen the deficit while lumbering young Australians with bigger personal loans.
The stark warning from federal parliament’s independent budget office reveals the true cost of grand promises from Labor and the Coalition in recent years, when they opened the doors to hundreds of thousands of additional students while also encouraging a big rise in fees.
The hit to the budget bottom line will swell from $1.7bn this year to $11.1bn a year a decade from now, a spending burden that dwarfs the extra money promised for the Gonski school reforms over the same period.
What a relief that we, here, have a more robust (relatively speaking) accounting and budgeting mechanism here that requires governments to update estimates of likely loan repayments.
See if you can guess who advised on abandoning that approach?
The only country that has a system like ours is Australia. The last time I was in Australia, comparing notes and discussing our two systems, when I asked the leading Australian expert what the Australian equivalent of the RAB charge was, he said, “I think when we launched the scheme five years ago, we did an estimate of write-offs, and come to think of it, we probably ought to have another look at it now.” The idea that every six months a new figure was churned out essentially based on what has happened to earnings in the previous six months compared with the OBR forecast in 2011 would have been regarded as absurd.
Update – 2 May 2016. Josh Winn has pointed out to me that the SLC is currently offline. Hopefully this is because SLC has taken the points below onboard. I have asked SLC for comment.
Update – 11 May 2016. SLC have replied to my query with the following statement: “The Repayment Calculator has been removed temporarily from the Student Loans Repayments website and gov.uk for maintenance and enhancement.”
Income contingent repayment loans are fundamentally different from any other loan or debt you are likely to encounter.
Student loans have additionally been designed to protect lower earners from unaffordable repayments and so have a high repayment threshold – you repay 9 per cent of your gross annual income above £21 000.
So if you earn £30 000 in a year you repay 9% of £9000 – £810. If you earn £21 000 no repayment is due.
In addition, outstanding loan balances are written off in the event of death, disability or thirty years after repayments first fall due (the April after you leave study).
Because repayments are contingent upon income, predicting how much you are likely to repay (the price of study) is difficult. You have to make a lot of assumptions about your future salary path and various economic variables (inflation, average earnings, etc.)
What guidance can you get in this regard? There are two kinds of ‘calculator’ in existence.
One is used to model the cost to government of the student loan policy. Here cost is the difference between what is loaned and what is repaid in net present value terms.
The other kind is aimed at individuals and asks them to input a starting salary and initial student debt before calculating an estimate of repayments in cash terms.
This website has mainly been concerned with the first kind of calculator but I have recently started looking at the second kind.
Today, I want to warn people about using the calculator provided by the Student Loans Company.
This is the worst one I have seen – mainly because it provides such limited information about its questionable assumptions.
These calculators are designed to inform you about your likely repayments, but the SLC calculator probably overestimates these for two reasons:
- it assumes you are male;
- it assumes large increments in salary in the first years after graduation regardless of the starting salary you input
Although I asked SLC for its modelling assumptions, I did not get answers to my specific questions. I was though able to access the code for the calculator.
On Thursday June 9th, I’ll be talking at the Literary & Philosophical Society of Newcastle as part of a series, ‘The Idea of Higher Education’, run jointly with Newcastle College.
I’ve taken my title from the final chapter of John Pratt‘s 1997 book The Polytechnic Experiment.
Title: ‘Whatever Happened to the Polytechnics?’
Venue: Literary & Philosophical Society, Newcastle-upon-Tyne
Time: 6-7pm
All Welcome. It’s free but registration is required. More details here.
In preparing the piece, I was struck by how that fact is obscured in Hefce’s document and how the connections with the recent Green Paper are left to the reader to work out. In particular, Hefce has dropped reference to a ‘publicly funded’ HE sector since it opened its consultation on quality assurance last year. One could read Hefce’s guidance and not realise that the gateway being discussed is a gateway to grant funding or that assurance about teaching quality was easing access to research and capital grants.
Decisions about ‘Hefce designation’ lie with Sajid Javid, secretary of state for Business, and there is no bar on for-profit organisations applying.
Last November, I covered the Chancellor’s Autumn Statement for wonkhe. I pointed out then that the Comprehensive Spending Review had left out any Resource Accounting & Budgeting charge from the budgetary allocations for Business, Innovation and Skills (to cover 2016/17 onwards). The RAB charge allocations are utilised by BIS to cover the ‘impairment’ on student loans (the annual difference between the cash used to create new loans and the estimated value of repayments those loans will generate).
I understood that BIS would have these allocations confirmed in “Spring”, around the time of the Budget I presumed. A spokesman for BIS confirmed that these allocations are still not available.
With loans now to replace maintenance grants and to be extended to nursing, part-time, postgraduate and doctoral study, the RAB allocation represents a key means by which the Treasury exercises financial control. As I wrote back in November, “because so much hangs on loans these days we won’t really be able to assess how BIS did out of this funding settlement until we see the RAB allocations.”
Other forms of control did get mentioned; the Budget did reaffirm measures announced earlier about publishing data on earnings (not simply including it in the TEF metrics).
1.102 … The government will bring together information about the wages of graduates of different courses and the financial support available across further and higher education to ensure that people can make informed decisions about the right courses for them.


